


Flutter动画图表插件animated_line_chart的使用
Flutter动画图表插件animated_line_chart的使用
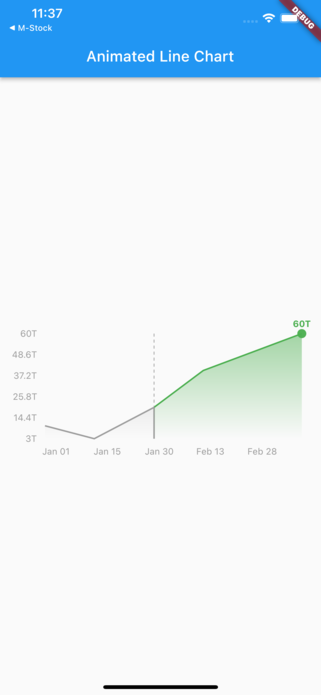
一个用于Flutter的动画折线图库。
- 支持日期轴
- 图表的动画效果
- 基于日期分割区域
开始使用
尝试样例项目或将其集成到你的项目中。
示例代码:
final List<DataPoint> data = [
  DataPoint(x: DateTime(2023, 1, 1), y: 10),
  DataPoint(x: DateTime(2023, 1, 15), y: 30),
  DataPoint(x: DateTime(2023, 2, 1), y: 20),
  DataPoint(x: DateTime(2023, 2, 15), y: 40),
  DataPoint(x: DateTime(2023, 3, 1), y: 50),
  DataPoint(x: DateTime(2023, 3, 15), y: 60),
];

return Scaffold(
  appBar: AppBar(
    title: Text(widget.title),
  ),
  body: Center(
    child: SizedBox(
      width: 300,
      height: 200,
      child: AnimatedLineChart(
        data: data,
        dividerX: DateTime(2023, 2, 1),
        leftChartColor: Colors.grey,
        rightChartColor: Colors.green,
      ),
    ),
  ),
);
贡献
欢迎贡献!你可以通过以下方式参与:
作者
- Muhammad Adib Yusrul Muna
许可证
版权所有 © 2023 Muhammad Adib Yusrul Muna
本软件根据MIT许可证分发。完整的许可证文本见LICENSE文件。
示例代码
import 'package:animated_line_chart/animated_line_chart.dart';
import 'package:flutter/material.dart';

void main() {
  runApp(const MyApp());
}

class MyApp extends StatelessWidget {
  const MyApp({super.key});

  [@override](/user/override)
  Widget build(BuildContext context) {
    return MaterialApp(
      title: 'Animated Line Chart',
      theme: ThemeData(
        primarySwatch: Colors.blue,
      ),
      home: const MyHomePage(title: 'Animated Line Chart'),
    );
  }
}

class MyHomePage extends StatefulWidget {
  const MyHomePage({super.key, required this.title});

  final String title;

  [@override](/user/override)
  State<MyHomePage> createState() => _MyHomePageState();
}

class _MyHomePageState extends State<MyHomePage> {
  final List<DataPoint> data = [
    DataPoint(x: DateTime(2023, 1, 1), y: 10000000000000),
    DataPoint(x: DateTime(2023, 1, 15), y: 3000000000000),
    DataPoint(x: DateTime(2023, 2, 1), y: 20000000000000),
    DataPoint(x: DateTime(2023, 2, 15), y: 40000000000000),
    DataPoint(x: DateTime(2023, 3, 1), y: 50000000000000),
    DataPoint(x: DateTime(2023, 3, 15), y: 60000000000000),
    DataPoint(x: DateTime(2023, 3, 16), y: 60000000000000),
    DataPoint(x: DateTime(2023, 3, 17), y: 60000000000000),
    DataPoint(x: DateTime(2023, 3, 18), y: 60000000000000),
  ];

  [@override](/user/override)
  Widget build(BuildContext context) {
    Size size = MediaQuery.of(context).size;
    return Scaffold(
      appBar: AppBar(
        title: Text(widget.title),
      ),
      body: Center(
        child: SizedBox(
          width: size.width, // 设置所需宽度
          height: 200, // 设置所需高度
          child: AnimatedLineChart(
            data: data,
            dividerX: DateTime(2023, 2, 1),
            // dividerXColor: Colors.grey,
            leftChartColor: Colors.grey,
            rightChartColor: Colors.green,
            // showXLabel: true,
            // showYLabel: true,
            // labelTextStyle: const TextStyle(color: Colors.grey, fontSize: 12),
            // showDotAnimation: false,
            // showLastData: true,
          ),
        ),
      ),
    );
  }
}
更多关于Flutter动画图表插件animated_line_chart的使用的实战教程也可以访问 https://www.itying.com/category-92-b0.html
1 回复

更多关于Flutter动画图表插件animated_line_chart的使用的实战系列教程也可以访问 https://www.itying.com/category-92-b0.html
当然,下面是一个关于如何在Flutter中使用animated_line_chart插件来创建动画图表的示例代码。这个插件通常用于显示随时间变化的数据,通过动画效果增强用户体验。
首先,确保你的pubspec.yaml文件中已经添加了animated_line_chart依赖:
dependencies:
  flutter:
    sdk: flutter
  animated_line_chart: ^x.y.z  # 替换为最新的版本号
然后,运行flutter pub get来安装依赖。
接下来,在你的Dart文件中,你可以使用以下代码来创建一个简单的动画图表:
import 'package:flutter/material.dart';
import 'package:animated_line_chart/animated_line_chart.dart';

void main() {
  runApp(MyApp());
}

class MyApp extends StatelessWidget {
  @override
  Widget build(BuildContext context) {
    return MaterialApp(
      title: 'Animated Line Chart Example',
      theme: ThemeData(
        primarySwatch: Colors.blue,
      ),
      home: Scaffold(
        appBar: AppBar(
          title: Text('Animated Line Chart Example'),
        ),
        body: LineChartExample(),
      ),
    );
  }
}

class LineChartExample extends StatefulWidget {
  @override
  _LineChartExampleState createState() => _LineChartExampleState();
}

class _LineChartExampleState extends State<LineChartExample> with SingleTickerProviderStateMixin {
  late AnimationController _controller;

  @override
  void initState() {
    super.initState();
    _controller = AnimationController(
      duration: const Duration(seconds: 2),
      vsync: this,
    )..repeat(reverse: true);
  }

  @override
  void dispose() {
    _controller.dispose();
    super.dispose();
  }

  @override
  Widget build(BuildContext context) {
    final data = [
      LineChartData(
        color: Colors.blue,
        label: 'Data 1',
        dataEntries: List.generate(
          20,
          (index) => LineChartEntry(
            x: index.toDouble(),
            y: (index * 2).toDouble(), // Example data, can be replaced with real data
          ),
        ),
      ),
      LineChartData(
        color: Colors.red,
        label: 'Data 2',
        dataEntries: List.generate(
          20,
          (index) => LineChartEntry(
            x: index.toDouble(),
            y: (index * 3).toDouble(), // Example data, can be replaced with real data
          ),
        ),
      ),
    ];

    return AnimatedLineChart(
      data: data,
      animation: _controller,
      width: double.infinity,
      height: 300,
    );
  }
}
在这个示例中,我们创建了一个简单的Flutter应用,其中包含一个动画折线图。以下是代码的关键部分:
- 依赖导入:我们导入了
animated_line_chart包。 - 数据准备:我们创建了一个包含两个数据集的列表
data,每个数据集包含颜色、标签和数据点。数据点是通过LineChartEntry类创建的,它接受x和y坐标。 - 动画控制器:我们创建了一个
AnimationController,它控制图表的动画。动画设置为持续2秒并无限重复。 - 图表构建:使用
AnimatedLineChart小部件,我们将准备好的数据和动画控制器传递给它,并设置了图表的宽度和高度。
这个示例展示了如何使用animated_line_chart包来创建具有动画效果的折线图。你可以根据需要调整数据集和动画参数,以适应你的具体需求。