


golang轻量级ASCII命令行图表绘制插件库asciigraph的使用
Golang轻量级ASCII命令行图表绘制插件库asciigraph的使用
简介
asciigraph是一个Go语言包,用于绘制轻量级的ASCII线形图。它可以将数据可视化为简单的命令行图表。
安装
go get -u github.com/guptarohit/asciigraph@latest
基本使用
基本图表
package main

import (
    "fmt"
    "github.com/guptarohit/asciigraph"
)

func main() {
    data := []float64{3, 4, 9, 6, 2, 4, 5, 8, 5, 10, 2, 7, 2, 5, 6}
    graph := asciigraph.Plot(data)

    fmt.Println(graph)
}
运行上述代码将输出以下图表:
  10.00 ┤        ╭╮
   9.00 ┤ ╭╮     ││
   8.00 ┤ ││   ╭╮││
   7.00 ┤ ││   ││││╭╮
   6.00 ┤ │╰╮  ││││││ ╭
   5.00 ┤ │ │ ╭╯╰╯│││╭╯
   4.00 ┤╭╯ │╭╯   ││││
   3.00 ┼╯  ││    ││││
   2.00 ┤   ╰╯    ╰╯╰╯
多系列图表
package main

import (
    "fmt"
    "github.com/guptarohit/asciigraph"
)

func main() {
    data := [][]float64{{0, 1, 2, 3, 3, 3, 2, 0}, {5, 4, 2, 1, 4, 6, 6}}
    graph := asciigraph.PlotMany(data)

    fmt.Println(graph)
}
输出:
 6.00 ┤    ╭─
 5.00 ┼╮   │
 4.00 ┤╰╮ ╭╯
 3.00 ┤ │╭│─╮
 2.00 ┤ ╰╮│ ╰╮
 1.00 ┤╭╯╰╯  │
 0.00 ┼╯     ╰
彩色图表
package main

import (
    "fmt"
    "github.com/guptarohit/asciigraph"
    "math"
)

func main() {
    data := make([][]float64, 4)

    for i := 0; i < 4; i++ {
        for x := -20; x <= 20; x++ {
            v := math.NaN()
            if r := 20 - i; x >= -r && x <= r {
                v = math.Sqrt(math.Pow(float64(r), 2)-math.Pow(float64(x), 2)) / 2
            }
            data[i] = append(data[i], v)
        }
    }
    graph := asciigraph.PlotMany(data,
        asciigraph.Precision(0),
        asciigraph.SeriesColors(
            asciigraph.Red,
            asciigraph.Yellow,
            asciigraph.Green,
            asciigraph.Blue,
        ))

    fmt.Println(graph)
}
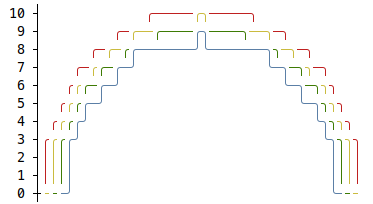
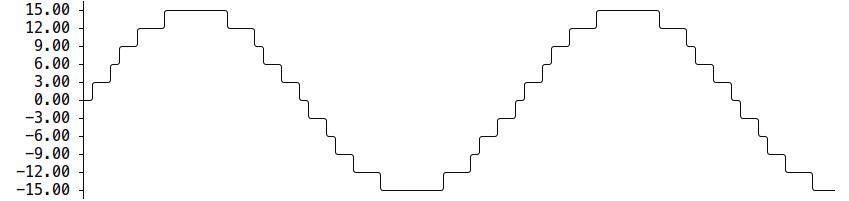
带图例的彩色图表
package main

import (
    "fmt"
    "github.com/guptarohit/asciigraph"
    "math"
)

func main() {
    data := make([][]float64, 3)
    for i := 0; i < 3; i++ {
        for x := -12; x <= 12; x++ {
            v := math.NaN()
            if r := 12 - i; x >= -r && x <= r {
                v = math.Sqrt(math.Pow(float64(r), 2)-math.Pow(float64(x), 2)) / 2
            }
            data[i] = append(data[i], v)
        }
    }
    graph := asciigraph.PlotMany(data,
        asciigraph.Precision(0),
        asciigraph.SeriesColors(asciigraph.Red, asciigraph.Green, asciigraph.Blue),
        asciigraph.SeriesLegends("Red", "Green", "Blue"),
        asciigraph.Caption("Series with legends"))
    fmt.Println(graph)
}

CLI工具
安装CLI工具
go install github.com/guptarohit/asciigraph/cmd/asciigraph@latest
或者使用Docker:
docker pull ghcr.io/guptarohit/asciigraph:latest
CLI使用示例
seq 1 72 | asciigraph -h 10 -c "plot data from stdin"
输出:
 72.00 ┤                                                                  ╭────
 64.90 ┤                                                           ╭──────╯
 57.80 ┤                                                    ╭──────╯
 50.70 ┤                                             ╭──────╯
 43.60 ┤                                      ╭──────╯
 36.50 ┤                              ╭───────╯
 29.40 ┤                       ╭──────╯
 22.30 ┤                ╭──────╯
 15.20 ┤         ╭──────╯
  8.10 ┤  ╭──────╯
  1.00 ┼──╯
                                  plot data from stdin
实时图表示例
ping -i.2 google.com | grep -oP '(?<=time=).*(?=ms)' --line-buffered | asciigraph -r -h 10 -w 40 -c "realtime plot data (google ping in ms) from stdin"
多系列实时图表示例
{unbuffer paste -d, <(ping -i 0.4 google.com | sed -u -n -E 's/.*time=(.*)ms.*/\1/p') <(ping -i 0.4 duckduckgo.com | sed -u -n -E 's/.*time=(.*)ms.*/\1/p') } | asciigraph -r -h 15 -w 60 -sn 2 -sc "blue,red" -c "Ping Latency Comparison" -sl "Google, DuckDuckGo"
总结
asciigraph是一个简单易用的Go库,可以在命令行中快速绘制ASCII图表,支持单系列和多系列数据,可以自定义颜色和图例,还提供了CLI工具方便直接在命令行中使用。
更多关于golang轻量级ASCII命令行图表绘制插件库asciigraph的使用的实战教程也可以访问 https://www.itying.com/category-94-b0.html
1 回复

更多关于golang轻量级ASCII命令行图表绘制插件库asciigraph的使用的实战系列教程也可以访问 https://www.itying.com/category-94-b0.html
使用 asciigraph 绘制 ASCII 命令行图表
asciigraph 是一个轻量级的 Go 库,用于在终端中绘制 ASCII 风格的图表。它非常适合在命令行应用程序中展示简单的数据可视化。
基本用法
首先安装 asciigraph:
go get github.com/guptarohit/asciigraph
简单折线图示例
package main

import (
	"fmt"
	"github.com/guptarohit/asciigraph"
)

func main() {
	data := []float64{3, 4, 9, 6, 2, 4, 5, 8, 5, 10, 2, 7, 2, 5, 6}

	graph := asciigraph.Plot(data)

	fmt.Println(graph)
}
输出结果类似:
 10.00 ┤        ╭╮
  9.00 ┤   ╭╮   ││
  8.00 ┤   ││   ││ ╭╮
  7.00 ┤   ││   ││ ││╭
  6.00 ┤ ╭╮││╭╮ ││ │││
  5.00 ┤ │││╰╯│╭╯│ │││
  4.00 ┤╭╯││  ││ │╭╯││
  3.00 ┼╯ ││  ││ ││ ││
  2.00 ┤  ││  ╰╯ ││ ╰╯
自定义图表选项
asciigraph 提供了多种配置选项来自定义图表外观:
package main

import (
	"fmt"
	"github.com/guptarohit/asciigraph"
)

func main() {
	data := []float64{1, 2, 3, 4, 5, 6, 7, 8, 9, 10}

	graph := asciigraph.Plot(data,
		asciigraph.Height(5),           // 设置图表高度
		asciigraph.Width(30),           // 设置图表宽度
		asciigraph.Caption("示例图表"),    // 添加标题
		asciigraph.Precision(1),        // 设置小数精度
		asciigraph.SeriesColors(
			asciigraph.Red,             // 设置线条颜色
		),
	)

	fmt.Println(graph)
}
多系列图表
可以同时绘制多个数据系列:
package main

import (
	"fmt"
	"github.com/guptarohit/asciigraph"
)

func main() {
	data1 := []float64{1, 2, 3, 4, 5}
	data2 := []float64{5, 4, 3, 2, 1}

	graph := asciigraph.PlotMany(
		[][]float64{data1, data2},
		asciigraph.Height(10),
		asciigraph.SeriesColors(
			asciigraph.Red,
			asciigraph.Blue,
		),
		asciigraph.Caption("多系列图表"),
	)

	fmt.Println(graph)
}
高级功能
自定义标签
package main

import (
	"fmt"
	"github.com/guptarohit/asciigraph"
)

func main() {
	data := []float64{10, 20, 30, 40, 50}

	graph := asciigraph.Plot(data,
		asciigraph.Height(10),
		asciigraph.Offset(3),
		asciigraph.LabelColor(asciigraph.Green),
		asciigraph.LabelLeft("Y轴"),
		asciigraph.LabelBottom("X轴"),
	)

	fmt.Println(graph)
}
实时数据更新
package main

import (
	"fmt"
	"math/rand"
	"time"

	"github.com/guptarohit/asciigraph"
)

func main() {
	rand.Seed(time.Now().UnixNano())

	for i := 0; i < 10; i++ {
		// 清屏(Unix-like系统)
		fmt.Print("\033[H\033[2J")

		data := make([]float64, 10)
		for j := range data {
			data[j] = rand.Float64() * 10
		}

		graph := asciigraph.Plot(data,
			asciigraph.Height(10),
			asciigraph.Caption(fmt.Sprintf("实时数据 #%d", i+1)),
		)

		fmt.Println(graph)
		time.Sleep(500 * time.Millisecond)
	}
}
asciigraph 是一个简单但功能强大的库,非常适合在命令行工具中添加基本的数据可视化功能。它轻量、无依赖,并且易于集成到现有的 Go 应用程序中。