


Python 数据分析之 pandas 进阶(二)如何使用?
python 数据分析之 pandas 进阶(二)
六、分组
对于“ group by ”操作,我们通常是指以下一个或多个操作步骤:
( Splitting )按照一些规则将数据分为不同的组 ( Applying )对于每组数据分别执行一个函数 ( Combining )将结果组合刀一个数据结构中 将要处理的数组是:
df = pd.DataFrame({
        'A': ['foo', 'bar', 'foo', 'bar', 'foo', 'bar', 'foo', 'foo'],
        'B': ['one', 'one', 'two', 'three', 'two', 'two', 'one', 'three'],
        'C': np.random.randn(8),
        'D': np.random.randn(8)
    })
df
A	B	C	        D
0	foo	one	0.961295	-0.281012
1	bar	one	0.901454	0.621284
2	foo	two	-0.584834	0.919414
3	bar	three	1.259104	-1.012103
4	foo	two	0.153107	1.108028
5	bar	two	0.115963	1.333981
6	foo	one	1.421895	-1.456916
7	foo	three	-2.103125	-1.757291
1 、分组并对每个分组执行 sum 函数:
df.groupby('A').sum()
C	        D
A
bar	2.276522	0.943161
foo	-0.151661	-1.467777
2 、通过多个列进行分组形成一个层次索引,然后执行函数:
df.groupby(['A', 'B']).sum()
	C	        D
A	B
bar	one	0.901454	0.621284
three	1.259104        -1.012103
two	0.115963        1.333981
foo	one	2.383191	-1.737928
three	-2.103125	-1.757291
two	-0.431727	2.027441
七、 Reshaping
Stack
tuples = list(zip(*[['bar', 'bar', 'baz', 'baz',
                     'foo', 'foo', 'qux', 'qux'],
                    ['one', 'two', 'one', 'two',
                     'one', 'two', 'one', 'two']]))
tuples
[(‘bar’, ‘one’),
(‘bar’, ‘two’),
(‘baz’, ‘one’),
(‘baz’, ‘two’),
(‘foo’, ‘one’),
(‘foo’, ‘two’),
(‘qux’, ‘one’),
(‘qux’, ‘two’)]
index = pd.MultiIndex.from_tuples(tuples, names=['first', 'second'])
df = pd.DataFrame(np.random.randn(8, 2), index=index, columns=['A', 'B'])
df2 = df[:4]
df2

		 A	        B
first	second
bar	one	-0.907306	-0.009961
        two	0.905177	-2.877961
baz	one	-0.356070	-0.373447
        two	-1.496644	-1.958782
stacked = df2.stack()
stacked

first  second
bar    one     A   -0.907306
               B   -0.009961
       two     A    0.905177
               B   -2.877961
baz    one     A   -0.356070
               B   -0.373447
       two     A   -1.496644
               B   -1.958782
dtype: float64
stacked.unstack()

		A	        B
first	second
bar	one	-0.907306	-0.009961
        two	0.905177	-2.877961
baz	one	-0.356070	-0.373447
        two	-1.496644	-1.958782
stacked.unstack(1)

	second	one	       two
first
bar	A	-0.907306	0.905177
        B	-0.009961	-2.877961
baz	A	-0.356070	-1.496644
        B	-0.373447	-1.958782
八、相关操作
要处理的数组为:
df
        A	        B	        C	        D	F
2013-01-01	0.000000	0.000000	0.135704	5	NaN
2013-01-02	0.139027	1.683491	-1.031190	5	1
2013-01-03	-0.596279	-1.211098	1.169525	5	2
2013-01-04	0.367213	-0.020313	2.169802	5	3
2013-01-05	0.224122	1.003625	-0.488250	5	4
2013-01-06	0.186073	-0.537019	-0.252442	5	5
(一)、统计
1 、执行描述性统计:
df.mean()
A    0.053359
B    0.153115
C    0.283858
D    5.000000
F    3.000000
dtype: float64
2 、在其他轴上进行相同的操作:
df.mean(1)
2013-01-01    1.283926
2013-01-02    1.358266
2013-01-03    1.272430
2013-01-04    2.103341
2013-01-05    1.947899
2013-01-06    1.879322
Freq: D, dtype: float64
3 、对于拥有不同维度,需要对齐的对象进行操作, pandas 会自动的沿着指定的维度进行广播
dates
s = pd.Series([1,3,4,np.nan,6,8], index=dates).shift(2)
s
DatetimeIndex([‘2013-01-01’, ‘2013-01-02’, ‘2013-01-03’, ‘2013-01-04’,
‘2013-01-05’, ‘2013-01-06’],
dtype=‘datetime64[ns]’, freq=‘D’)
2013-01-01   NaN
2013-01-02   NaN
2013-01-03     1
2013-01-04     3
2013-01-05     4
2013-01-06   NaN
Freq: D, dtype: float64
(二)、 Apply
对数据应用函数:
df.apply(np.cumsum)
        A	        B	        C	        D	F
2013-01-01	0.000000	0.000000	0.135704	5	NaN
2013-01-02	0.139027	1.683491	-0.895486	10	1
2013-01-03	-0.457252	0.472393	0.274039	15	3
2013-01-04	-0.090039	0.452081	2.443841	20	6
2013-01-05	0.134084	1.455706	1.955591	25	10
2013-01-06	0.320156	0.918687	1.703149	30	15
df.apply(lambda x: x.max() - x.min())

A    0.963492
B    2.894589
C    3.200992
D    0.000000
F    4.000000
dtype: float64
(三)、字符串方法
Series 对象在其 str 属性中配备了一组字符串处理方法,可以很容易的应用到数组中的每个元素。
s = pd.Series(['A', 'B', 'C', 'Aaba', 'Baca', np.nan, 'CABA', 'dog', 'cat'])
s.str.lower()
0       a
1       b
2       c
3    aaba
4    baca
5     NaN
6    caba
7     dog
8     cat
dtype: object
九、时间序列
1 、时区表示:
rng = pd.date_range('3/6/2012 00:00', periods=5, freq='D')
ts = pd.Series(np.random.randn(len(rng)), rng)
ts
2012-03-06   -0.932261
2012-03-07   -1.405305
2012-03-08    0.809844
2012-03-09   -0.481539
2012-03-10   -0.489847
Freq: D, dtype: float64
ts_utc = ts.tz_localize('UTC')
ts_utc

2012-03-06 00:00:00+00:00   -0.932261
2012-03-07 00:00:00+00:00   -1.405305
2012-03-08 00:00:00+00:00    0.809844
2012-03-09 00:00:00+00:00   -0.481539
2012-03-10 00:00:00+00:00   -0.489847
Freq: D, dtype: float64
2 、时区转换
ts_utc.tz_convert('US/Eastern')
2012-03-05 19:00:00-05:00   -0.932261
2012-03-06 19:00:00-05:00   -1.405305
2012-03-07 19:00:00-05:00    0.809844
2012-03-08 19:00:00-05:00   -0.481539
2012-03-09 19:00:00-05:00   -0.489847
Freq: D, dtype: float64
3 、时区跨度转换
rng = pd.date_range('1/1/2012', periods=5, freq='M')
ts = pd.Series(np.random.randn(len(rng)), index=rng)
ps = ts.to_period()
ts
ps
ps.to_timestamp()
2012-01-31    0.932519
2012-02-29    0.247016
2012-03-31   -0.946069
2012-04-30    0.267513
2012-05-31   -0.554343
Freq: M, dtype: float64
2012-01    0.932519
2012-02    0.247016
2012-03   -0.946069
2012-04    0.267513
2012-05   -0.554343
Freq: M, dtype: float64
2012-01-01    0.932519
2012-02-01    0.247016
ts = pd.Series(np.random.randn(1000), index=pd.date_range('1/1/2000', periods=1000))
ts = ts.cumsum()
ts2012-03-01   -0.946069
2012-04-01    0.267513
2012-05-01   -0.554343
Freq: MS, dtype: float64
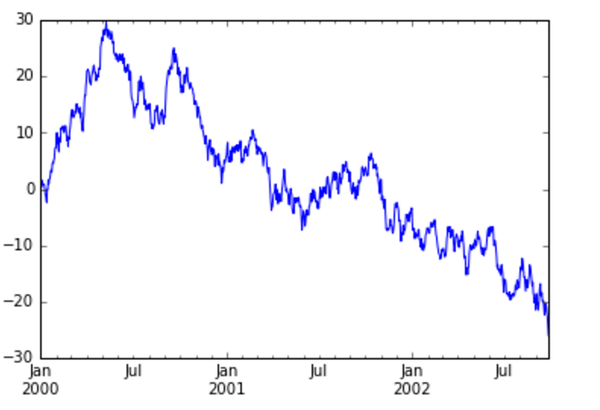
十、画图
ts = pd.Series(np.random.randn(1000), index=pd.date_range('1/1/2000', periods=1000))
ts = ts.cumsum()
ts
十一、 Categorical
从 0.15 版本开始, pandas 可以在 DataFrame 中支持 Categorical 类型的数据
df = pd.DataFrame({
        'id':[1,2,3,4,5,6],
        'raw_grade':['a','b','b','a','a','e']
    })
df
id	raw_grade
0	1	a
1	2	b
2
4	a
4	5	a
5	6	e
1 、将原始的 grade 转换为 Categorical 数据类型:
df['grade'] = df['raw_grade'].astype('category', ordered=True)
df['grade']
0    a
1    b
2    b
3    a
4    a
5    e
Name: grade, dtype: category
Categories (3, object): [a < b < e]
2 、将 Categorical 类型数据重命名为更有意义的名称:
df['grade'].cat.categories = ['very good', 'good', 'very bad']
3 、对类别进行重新排序,增加缺失的类别:
df['grade'] = df['grade'].cat.set_categories(['very bad', 'bad', 'medium', 'good', 'very good'])
df['grade']
0    very good
1         good
2         good
3    very good
4    very good
5     very bad
Name: grade, dtype: category
Categories (5, object): [very bad < bad < medium < good < very good]
4 、排序是按照 Categorical 的顺序进行的而不是按照字典顺序进行:
df.sort('grade')
id	raw_grade	grade
5	6	e	        very bad
1	2	b	        good
2	3	b	        good
0	1	a	        very good
3	4	a	        very good
4	5	a	        very good
5 、对 Categorical 列进行排序时存在空的类别:
df.groupby("grade").size()
grade
very bad     1
bad          0
medium       0
good         2
very good    3
dtype: int64
以上代码不想自己试一试吗?
镭矿 raquant提供 jupyter 在线练习学习 python 的机会,无需安装 python 即可运行 python 程序。
Python 数据分析之 pandas 进阶(二)如何使用?


