


Golang内存分配空间与泄漏问题解决方案
Golang内存分配空间与泄漏问题解决方案 我们正在面临一个Go语言REST API + ECS中的内存泄漏问题,只有重启才能修复。
问题:
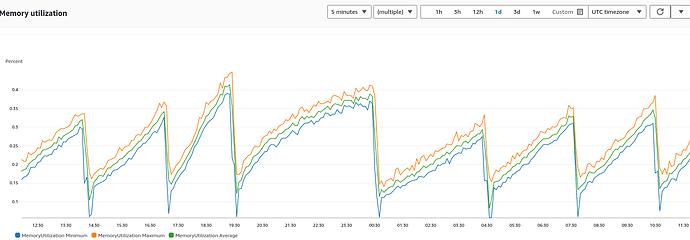
内存使用率不会超过0.7。当内存使用率达到0.7时,Go应用停止响应,我们必须重启它。
我们第一次尝试使用pprof并查看了分配空间。因为这是一个REST API,我们返回的是加密的JSON。我们怀疑用于此问题的加密方法,并希望确认我们是否找对了方向。
可疑代码及我们尝试过的
    dashboard := make(map[string]interface{})
dashboard["feature_banner"] = l_feature_data
dashboard["home_category"] = home_category_data
res["dashboard"] = dashboard

mres, _ := json.Marshal(res)
ress := ""
ress = util.EncryptDatas(string(mres))
c.JSON(200, gin.H{"code": 1, "result": ress})
func EncryptDatas(data string) string {
bKey := []byte(key)
bIV := []byte(iv)
bPlaintext := PKCS5PaddingNew([]byte(data), aes.BlockSize, len(data))
block, err := aes.NewCipher(bKey)
if err != nil {
}
ciphertext := make([]byte, len(bPlaintext))
mode := cipher.NewCBCEncrypter(block, bIV)
mode.CryptBlocks(ciphertext, bPlaintext)
return hex.EncodeToString(ciphertext)
}
分配空间 -> EncryptDatas + String(res) : 2493.72MB, 占总内存 2679.79MB 的 93.06% - https://ibb.co/wdrKD0T
分配空间 -> 不使用 EncryptDatas 和 String(res) : 1256.06MB, 占总内存 1436.63MB 的 87.43% : https://ibb.co/t3yTR05
分配空间 -> 仅使用 String(res) : 1692.63MB, 占总内存 1847.71MB 的 91.61% : https://ibb.co/7N84yMS
我们寻求以下方面的帮助:
- 我们找问题的方向对吗?以前从未用过pprof。
- 是加密导致了问题吗?
hex.EncodeToString可能是问题所在吗? - 我们能否在Go中手动清理堆/内存,以阻止其达到0.7?
另外,这不是某个特定API的问题。
更多关于Golang内存分配空间与泄漏问题解决方案的实战教程也可以访问 https://www.itying.com/category-94-b0.html

也许你已经这么做了,但我发现在网页浏览器中启动pprof能更容易地找到导致内存分配的调用路径。只需运行:
go tool pprof -http=:8080 /path/to/pprof/collection.gz
然后你就可以查看导致这些分配的调用图。
更多关于Golang内存分配空间与泄漏问题解决方案的实战系列教程也可以访问 https://www.itying.com/category-94-b0.html

如果这确实是一个内存泄漏(从数据来看很可能是),那么您没有清理/关闭某些资源,导致其占用空间无限制地增长。垃圾回收器通常会回收不再使用的旧数据。但这可能会被残留的协程、指针或类似因素所阻碍。
请确保使用适当的代码检查工具(golangci-lint 包含多条规则来检查潜在的内存泄漏。)根据我的经验,许多泄漏仅仅是因为缺少 defer response.Body.Close()。
感谢大家。从 pprof 来看,似乎两种方法都在造成内存泄漏或导致内存使用图上升。json.Marshal 和 EncryptDatas 这两个方法用于发送加密响应。
mres, _ := json.Marshal(res)
ress := ""
func EncryptDatas(data string) string {
bKey := byte(key)
bIV := byte(iv)
bPlaintext := PKCS5PaddingNew(byte(data), aes.BlockSize, len(data))
block, err := aes.NewCipher(bKey)
if err != nil {
}
ciphertext := make(byte, len(bPlaintext))
mode := cipher.NewCBCEncrypter(block, bIV)
mode.CryptBlocks(ciphertext, bPlaintext)
return hex.EncodeToString(ciphertext)
}

根据你提供的pprof数据,加密函数确实是内存分配的主要来源。EncryptDatas函数在每次调用时都会创建多个字节切片,这些分配在大量请求下会累积压力。
以下是具体分析和优化方案:
1. 加密函数的内存分配分析
func EncryptDatas(data string) string {
    bKey := []byte(key)           // 分配1:字符串转字节切片
    bIV := []byte(iv)             // 分配2:字符串转字节切片
    bPlaintext := PKCS5PaddingNew([]byte(data), aes.BlockSize, len(data)) // 分配3:字符串转字节切片+新切片
    block, err := aes.NewCipher(bKey)
    if err != nil {
        // 错误处理缺失
    }
    ciphertext := make([]byte, len(bPlaintext)) // 分配4:密文缓冲区
    mode := cipher.NewCBCEncrypter(block, bIV)
    mode.CryptBlocks(ciphertext, bPlaintext)
    return hex.EncodeToString(ciphertext) // 分配5:十六进制编码字符串
}
2. 优化后的加密函数
var (
    keyBytes = []byte(key) // 预转换,避免重复分配
    ivBytes  = []byte(iv)  // 预转换,避免重复分配
    block    cipher.Block
    initErr  error
)

func init() {
    block, initErr = aes.NewCipher(keyBytes)
    if initErr != nil {
        panic("aes cipher init failed: " + initErr.Error())
    }
}

func EncryptDatasOptimized(data string) (string, error) {
    // 一次性分配所有需要的缓冲区
    plaintext := []byte(data)
    paddedSize := ((len(plaintext) + aes.BlockSize) / aes.BlockSize) * aes.BlockSize
    ciphertext := make([]byte, paddedSize)

    // 使用预分配的block
    if initErr != nil {
        return "", initErr
    }

    // 原地填充
    padLen := aes.BlockSize - (len(plaintext) % aes.BlockSize)
    for i := 0; i < padLen; i++ {
        plaintext = append(plaintext, byte(padLen))
    }

    mode := cipher.NewCBCEncrypter(block, ivBytes)
    mode.CryptBlocks(ciphertext, plaintext)

    // 使用strings.Builder避免临时字符串分配
    var hexBuilder strings.Builder
    hexBuilder.Grow(len(ciphertext) * 2) // 预分配空间
    hex.Encode(&hexBuilder, ciphertext)

    return hexBuilder.String(), nil
}
3. JSON序列化优化
// 使用sync.Pool复用缓冲区
var jsonPool = sync.Pool{
    New: func() interface{} {
        return &bytes.Buffer{}
    },
}

func MarshalAndEncrypt(res map[string]interface{}) (string, error) {
    // 从池中获取缓冲区
    buf := jsonPool.Get().(*bytes.Buffer)
    buf.Reset()
    defer jsonPool.Put(buf)

    // 直接编码到缓冲区
    encoder := json.NewEncoder(buf)
    if err := encoder.Encode(res); err != nil {
        return "", err
    }

    // 加密
    encrypted, err := EncryptDatasOptimized(buf.String())
    if err != nil {
        return "", err
    }

    return encrypted, nil
}
4. 响应处理优化
func handleDashboard(c *gin.Context) {
    dashboard := make(map[string]interface{})
    dashboard["feature_banner"] = l_feature_data
    dashboard["home_category"] = home_category_data
    res := map[string]interface{}{
        "dashboard": dashboard,
    }

    // 使用优化后的函数
    encryptedResult, err := MarshalAndEncrypt(res)
    if err != nil {
        c.JSON(500, gin.H{"error": "encryption failed"})
        return
    }

    c.JSON(200, gin.H{
        "code":   1,
        "result": encryptedResult,
    })
}
5. 内存管理建议
Go的垃圾回收是自动的,但你可以通过以下方式减少压力:
// 定期强制GC(谨慎使用)
func scheduleGC() {
    go func() {
        for {
            time.Sleep(5 * time.Minute)
            debug.FreeOSMemory() // 释放内存给操作系统
        }
    }()
}

// 设置合理的GC百分比
func init() {
    // 默认100,降低可以减少GC频率但增加堆大小
    debug.SetGCPercent(80)
}
6. 监控和诊断
// 添加内存监控端点
func setupMonitoring(router *gin.Engine) {
    router.GET("/debug/memory", func(c *gin.Context) {
        var m runtime.MemStats
        runtime.ReadMemStats(&m)

        c.JSON(200, gin.H{
            "alloc":      m.Alloc,
            "total_alloc": m.TotalAlloc,
            "sys":        m.Sys,
            "num_gc":     m.NumGC,
            "heap_inuse": m.HeapInuse,
            "heap_idle":  m.HeapIdle,
        })
    })
}
主要优化点:
- 预转换常量为字节切片
- 复用加密器实例
- 使用
strings.Builder减少字符串分配 - 使用
sync.Pool复用JSON编码缓冲区 - 合理设置GC参数
这些修改应该能显著减少内存分配,缓解内存压力达到0.7阈值的问题。